

Vue3 Element-UI中使用ECharts(前端数据展示开发)
-
前端数据展示(数据可视化、数据大屏等)可使用的工具比较多,很多第三方都提供了在线平台,比如阿里云,只需数据接口,在线配置一下界面即可使用。
(图片来源网络,侵删)- 阿里云的使用:利用阿里云物联网平台(IoT)实现WEB数据可视化
- 第三方平台对比:有哪些免费简单的数据展示(数据可视化)网站
-
也可以使用开源代码自己开发前端,本文所介绍的就是ECharts的开发,这是一款基于JavaScript 的开源可视化图表库,可以流畅的运行在 PC 和移动设备上,兼容当前绝大部分浏览器(IE9/10/11,Chrome,Firefox,Safari等),底层依赖矢量图形库 ZRender,提供直观,交互丰富,可高度个性化定制的数据可视化图表。
- 官方网站:https://echarts.apache.org/zh/index.html
- 官方示例:https://echarts.apache.org/examples/zh/index.html
- 官方指南:https://echarts.apache.org/handbook/zh/get-started/
注意,本文是在Vue3版本下的Element-UI中使用,ECharts官网打开较慢,可尝试翻越。
安装
npm install echarts --save
调用
创建一个*.vue页面,实现方法如下三种。
1. 本页数据
修改官方代码:https://echarts.apache.org/handbook/zh/basics/import
import * as echarts from 'echarts' export default { data() { return {} }, created() {}, // DOM 渲染完成触发 mounted() { // 基于准备好的dom,初始化echarts实例 var myChart = echarts.init(document.getElementById('main')) // 绘制图表 myChart.setOption({ title: { text: 'ECharts 入门示例' }, tooltip: {}, xAxis: { data: ['衬衫', '羊毛衫', '雪纺衫', '裤子', '高跟鞋', '袜子'] }, yAxis: {}, series: [ { name: '销量', type: 'bar', data: [5, 20, 36, 10, 10, 20] } ] }); } }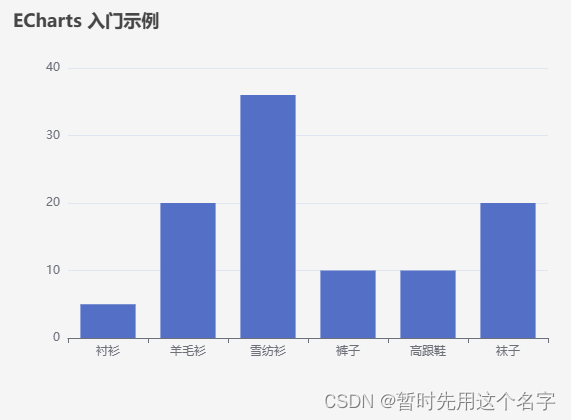 (图片来源网络,侵删)
2. 调用数据
修改官方的线性图示例图代码,修改为线性和柱状混合展示图
https://echarts.apache.org/examples/zh/editor.html?c=data-transform-filter&lang=js
另需准备一个json文件,下载自官网:https://echarts.apache.org/examples/data/asset/data/life-expectancy-table.json
本例中将文件放于根目录,本例中路径为:http://localhost/life-expectancy-table.json
import * as echarts from 'echarts'
import axios from 'axios'
import { nextTick } from 'vue'


export default {
  data() {
    return {}
  },
  created() {},
  // DOM 渲染完成触发
  mounted() {
  	// 数据来源,注意自行修改
    var url = 'http://localhost/life-expectancy-table.json';

    // 基于准备好的dom,初始化echarts实例
    var myChart = echarts.init(document.getElementById('main'))
    // 每隔三秒发起请求,获取数据并绘制图表
    nextTick(() => {
      setInterval(() => {
      	// 执行
        this.run(url, myChart);
      }, 3000)
    })
  },
  methods: {
  	// 执行
    run (url, obj){
      // 调用json
      axios.get(url).then(res => {
        let option = {
          dataset: [
            {
              id: 'dataset_raw',
              source: res.data
            },
            {
              id: 'dataset_since_1950_of_germany',
              fromDatasetId: 'dataset_raw',
              transform: {
                type: 'filter',
                config: {
                  and: [
                    { dimension: 'Year', gte: 1950 },
                    { dimension: 'Country', '=': 'Germany' }
                  ]
                }
              }
            },
            {
              id: 'dataset_since_1950_of_france',
              fromDatasetId: 'dataset_raw',
              transform: {
                type: 'filter',
                config: {
                  and: [
                    { dimension: 'Year', gte: 1950 },
                    { dimension: 'Country', '=': 'France' }
                  ]
                }
              }
            }
          ],
          title: {
            text: 'Income of Germany and France since 1950'
          },
          tooltip: {
            trigger: 'axis'
          },
          xAxis: {
            type: 'category',
            nameLocation: 'middle'
          },
          yAxis: {
            name: 'Income'
          },
          series: [
            {
              type: 'line',
              datasetId: 'dataset_since_1950_of_germany',
              showSymbol: false,
              encode: {
                x: 'Year',
                y: 'Income',
                itemName: 'Year',
                tooltip: ['Income']
              }
            },
            {
              type: 'bar',
              datasetId: 'dataset_since_1950_of_france',
              showSymbol: false,
              encode: {
                x: 'Year',
                y: 'Income',
                itemName: 'Year',
                tooltip: ['Income']
              }
            }
          ]
        };

        obj.setOption(option);
      })
    }
  }
}
展示图
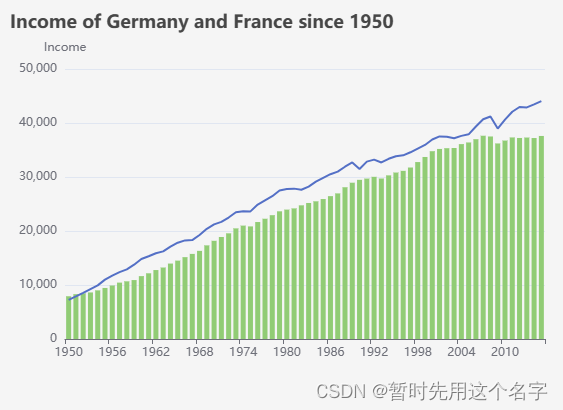 (图片来源网络,侵删)
- 可以顺便学习一下vue3中 nextTick 的具体用法。
3. 异步调用
还是上面的例子(实现略有不同),setInterval()中原有的run()函数改为了getOpt()函数,主要用来学习axios如何返回值~~
学习:获取axios的return值
import * as echarts from 'echarts'
import axios from 'axios'
import { nextTick } from 'vue'


export default {
  data() {
    return {}
  },
  created() {},
  // DOM 渲染完成触发
  mounted() {
  	// 数据来源,注意自行修改
    var url = 'http://localhost/life-expectancy-table.json';

    // 基于准备好的dom,初始化echarts实例
    var myChart = echarts.init(document.getElementById('main'))
    // 每隔三秒发起请求,获取数据并绘制图表
    nextTick(() => {
      setInterval(() => {
      	// 与上面不同的实现方式
        this.getOpt(url).then(opt=>{
          myChart.setOption(opt);
        });
      }, 3000)
    })
  },
  methods: {
  	// 获取
    async getOpt (url){
      let option;
      // 调用json
      await axios.get(url).then(res => {
        option = {
          dataset: [
            {
              id: 'dataset_raw',
              source: res.data
            },
            {
              id: 'dataset_since_1950_of_germany',
              fromDatasetId: 'dataset_raw',
              transform: {
                type: 'filter',
                config: {
                  and: [
                    { dimension: 'Year', gte: 1950 },
                    { dimension: 'Country', '=': 'Germany' }
                  ]
                }
              }
            },
            {
              id: 'dataset_since_1950_of_france',
              fromDatasetId: 'dataset_raw',
              transform: {
                type: 'filter',
                config: {
                  and: [
                    { dimension: 'Year', gte: 1950 },
                    { dimension: 'Country', '=': 'France' }
                  ]
                }
              }
            }
          ],
          title: {
            text: 'Income of Germany and France since 1950'
          },
          tooltip: {
            trigger: 'axis'
          },
          xAxis: {
            type: 'category',
            nameLocation: 'middle'
          },
          yAxis: {
            name: 'Income'
          },
          series: [
            {
              type: 'line',
              datasetId: 'dataset_since_1950_of_germany',
              showSymbol: false,
              encode: {
                x: 'Year',
                y: 'Income',
                itemName: 'Year',
                tooltip: ['Income']
              }
            },
            {
              type: 'bar',
              datasetId: 'dataset_since_1950_of_france',
              showSymbol: false,
              encode: {
                x: 'Year',
                y: 'Income',
                itemName: 'Year',
                tooltip: ['Income']
              }
            }
          ]
        };
      })

      return option;
    }
  }
}
4. 多表同时
结合两种不同的图标放在一个页面,其中新增一种表为:
https://echarts.apache.org/examples/zh/editor.html?c=gauge-ring
import * as echarts from 'echarts'
import axios from 'axios'
import { nextTick } from 'vue'


export default {
  data() {
    return {}
  },
  created() {},
  // DOM 渲染完成触发
  mounted() {
  	// 数据来源,注意自行修改
    var url = 'http://localhost/life-expectancy-table.json';

    // 基于准备好的dom,初始化echarts实例
    var myMain = echarts.init(document.getElementById('main'))
    var mySub = echarts.init(document.getElementById('sub'))
    var option;
    const gaugeData = [
      {
        value: 20,
        name: 'Perfect',
        title: {
          offsetCenter: ['0%', '-30%']
        },
        detail: {
          valueAnimation: true,
          offsetCenter: ['0%', '-20%']
        }
      },
      {
        value: 40,
        name: 'Good',
        title: {
          offsetCenter: ['0%', '0%']
        },
        detail: {
          valueAnimation: true,
          offsetCenter: ['0%', '10%']
        }
      },
      {
        value: 60,
        name: 'Commonly',
        title: {
          offsetCenter: ['0%', '30%']
        },
        detail: {
          valueAnimation: true,
          offsetCenter: ['0%', '40%']
        }
      }
    ];
    option = {
      series: [
        {
          type: 'gauge',
          startAngle: 90,
          endAngle: -270,
          pointer: {
            show: false
          },
          progress: {
            show: true,
            overlap: false,
            roundCap: true,
            clip: false,
            itemStyle: {
              borderWidth: 1,
              borderColor: '#464646'
            }
          },
          axisLine: {
            lineStyle: {
              width: 40
            }
          },
          splitLine: {
            show: false,
            distance: 0,
            length: 10
          },
          axisTick: {
            show: false
          },
          axisLabel: {
            show: false,
            distance: 50
          },
          data: gaugeData,
          title: {
            fontSize: 14
          },
          detail: {
            width: 50,
            height: 14,
            fontSize: 14,
            color: 'inherit',
            borderColor: 'inherit',
            borderRadius: 20,
            borderWidth: 1,
            formatter: '{value}%'
          }
        }
      ]
    };
    // 每隔三秒发起请求,获取数据并绘制图表
    nextTick(() => {
      setInterval(() => {
      	// main部分
        this.getOptMain(url).then(opt=>{
          myMain.setOption(opt);
        });
		// sub部分
        gaugeData[0].value = +(Math.random() * 100).toFixed(2);
        gaugeData[1].value = +(Math.random() * 100).toFixed(2);
        gaugeData[2].value = +(Math.random() * 100).toFixed(2);
        mySub.setOption({
          series: [
            {
              data: gaugeData,
              pointer: {
                show: false
              }
            }
          ]
        });
      }, 3000)
    })

    option && mySub.setOption(option);
  },
  methods: {
  	// 获取
    async getOptMain (url){
      let option;
      // 调用json
      await axios.get(url).then(res => {
        option = {
          dataset: [
            {
              id: 'dataset_raw',
              source: res.data
            },
            {
              id: 'dataset_since_1950_of_germany',
              fromDatasetId: 'dataset_raw',
              transform: {
                type: 'filter',
                config: {
                  and: [
                    { dimension: 'Year', gte: 1950 },
                    { dimension: 'Country', '=': 'Germany' }
                  ]
                }
              }
            },
            {
              id: 'dataset_since_1950_of_france',
              fromDatasetId: 'dataset_raw',
              transform: {
                type: 'filter',
                config: {
                  and: [
                    { dimension: 'Year', gte: 1950 },
                    { dimension: 'Country', '=': 'France' }
                  ]
                }
              }
            }
          ],
          title: {
            text: 'Income of Germany and France since 1950'
          },
          tooltip: {
            trigger: 'axis'
          },
          xAxis: {
            type: 'category',
            nameLocation: 'middle'
          },
          yAxis: {
            name: 'Income'
          },
          series: [
            {
              type: 'line',
              datasetId: 'dataset_since_1950_of_germany',
              showSymbol: false,
              encode: {
                x: 'Year',
                y: 'Income',
                itemName: 'Year',
                tooltip: ['Income']
              }
            },
            {
              type: 'bar',
              datasetId: 'dataset_since_1950_of_france',
              showSymbol: false,
              encode: {
                x: 'Year',
                y: 'Income',
                itemName: 'Year',
                tooltip: ['Income']
              }
            }
          ]
        };
      })

      return option;
    }
  }
}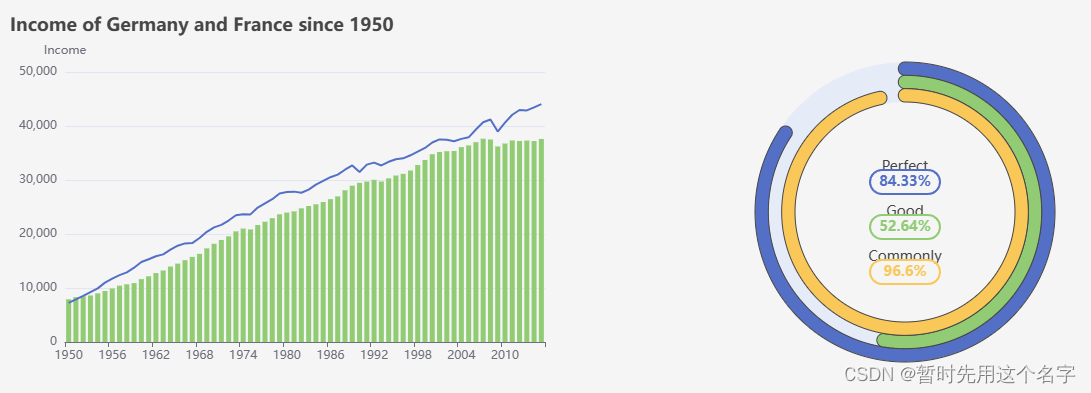
参考:
Vue Element UI 之ECharts图表
Echarts 在vue3x中使用(包括动态数据变化)
优化了三年经验者的Echarts卡顿
关于vue+elementui 访问本地json和跨域访问API问题
Vue3+ElementPlus+Axios实现从后端请求数据并渲染
Vue3中的Methods用法介绍
Vue3中你应该知道的setup!

,词库加载错误:未能找到文件“C:\Users\Administrator\Desktop\火车头9.8破解版\Configuration\Dict_Stopwords.txt”。,使用,访问,方法,第1张")
,词库加载错误:未能找到文件“C:\Users\Administrator\Desktop\火车头9.8破解版\Configuration\Dict_Stopwords.txt”。,使用,访问,方法,第4张")
,词库加载错误:未能找到文件“C:\Users\Administrator\Desktop\火车头9.8破解版\Configuration\Dict_Stopwords.txt”。,使用,访问,方法,第6张")
")
")
")
")
还没有评论,来说两句吧...